
11 The JTRConsole
The JTRConsole is the user interface that automatically pops-up at test-completion. The JTRConsole, introduced with JTR 4, let’s you browse your test results and proposes you some useful aggregate data collected after the test accomplishment.
In this section you are going to learn how to take advantage of this simple intuitive user interface.
The JTR Test Progress Notifier
After having just launched your test-suite the JTR Test Progress Notifier will appear:

This window keeps you informed about the percentage of both local epochs that have been started and of global-tests accomplished. It is important to note that while it keeps track of fine grained local epochs accomplishments, this is not true for remote tests spawned in the current session. This happens just to reduce the traffic amongst the involved nodes. The Local Runs informs you about the number of accomplished local runs over the total number of required runs per epoch.
When running distributed test-suites it is possible that different nodes will complete the same test-suite at different moments in time. If for example the active-node is the fastest one, you’ll see something like this:

This means that while the local epochs have all been completed, there are still pending distributed JTR sessions. In this example we just had two sessions (the local and the remote one), thus we see that currently only the 50% of the desired test sessions has been carried out.
Anyway, even if there are still pending sessions, the accomplishment of at least one session causes the JTRConsole to appear. The JTRConsole will be progressively updated with results provided by those pending JTR-sessions as they come available. In this way problems that could arise after JTR passive-nodes have been involved in the distributed JTR-session won’t prevent you from consulting at least those outcomes that were actually received.
The JTRConsole

The figure above shows how the JTRConsole looks like once it appears. In the left-side there is the JTR-Nodes Tree that shows all the JTR-nodes involved in the JTR (distributed) session. In this example we can see two nodes. Both of them have been run on the localhost but with different TCP ports configurations obviously (go here for further details).
Expanding a JTR-node you get the list of all the runner-categories whose instances have been run during the test on the expanded JTR-node.

Expanding a category-node you get the list of its instances that have been run on that JTR-node, and if you click on a specific instance you can see that the Runners’ Performance Table gets filled in with all the outcomes produced by that specific runner instance:

The Runners’ Performance Table exposes the following columns:
-
•Epoch: the epoch in which the outcome (represented by a row) was generated
-
•Run: the run, in the given epoch, in which the outcome was generated
-
•Time Stamp: the time at which the current run was started
-
•Elapsed: the time (in milli-seconds) required for the run to complete
-
•Status: whether the run failed or not
-
•Custom Msg: displays, if available, the user-object that you can associate with every outcome (see here for further details)
-
•Error Msg: displays, if available, the stack-trace of the occurred error
Please, also note that at the bottom of the Runners’ Performance Table you can find the average of all the collected values under the Elapsed column.
The Runner’s Message Details
The Runners’ Performance Table only provides you with an overview of what happened during the runs carried out by a specific runner instance. In order to have more information about an outcome that stores a user-message or a stack-trace you are interested in, you can double-click on a row to see the Run Inspector pop-up:
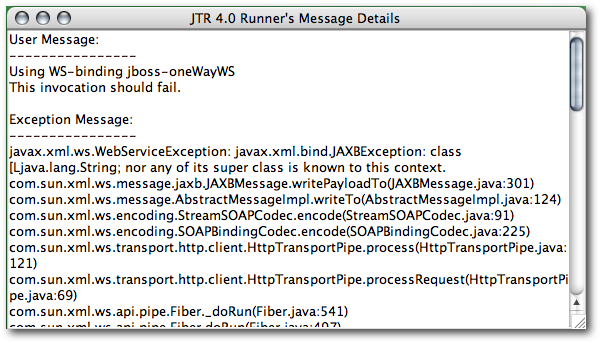
At the moment this inspector provides only the expanded view of both the User Message and the Exception Message stored in the outcome.
The Test Briefing
Maybe, before drilling down the test’s outcomes, you might be interested in much more corse-grained information. If it is the case you can take a look at the JTR Test Briefing. It can be accessed both from the JTRConsole menu-bar
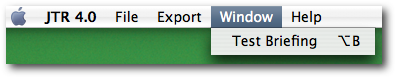
and with the ALT-B key combination (as you can see from the picture above). The JTR Test Briefing appears like this:
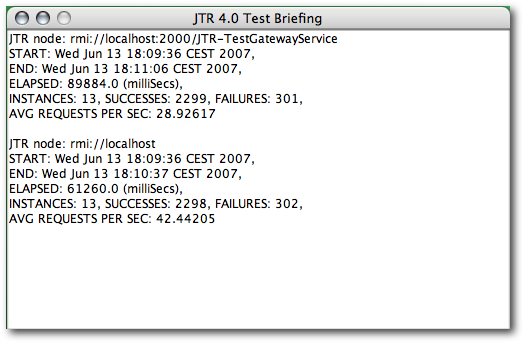
As you can see it shows, for each JTR-node that took part in the JTR (distributed) test session
-
•when the test session started
-
•when the test session ended
-
•the elapsed time required by the whole session in milli-seconds
-
•the number of involved runner instances
-
•the number of successes
-
•the number of failures
-
•the average number of runs (both failed and succeeded) per second
Exporting outcomes
It can be useful exporting all the results you can see in the JTRConsole to a file, both for keeping an history of your tests and for post-processing the collected data in order to have some graphical representation to show. In this case the JTR Export feature comes in handy.
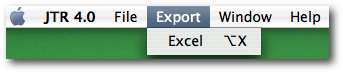
At the moment the only supported format is Excel. The export functionality produces an Excel spread-sheet with one sheet for each JTR-node involved in the test.
Conclusion
With this section the JTR users’ guide comes to its end. We have studied all of the features the JTR Project provides its users with, we have learnt how to write down a well-formed jtr.xml file, how to write our own runners for testing JSE and JEE components, JMS systems and Web-Services, and how to perform distributed testing sessions.
While all these sections were meant for JTR users, the next is for JTR customizers. What we are going to see is which pluggability points the JTR Project exposes and how to plug into the JTR-runtime your custom components.
